Displaying data as a Graph
All numerical data can display as a graph, this is a useful way to monitor trends:
- From Consultation Manager
 , select the patient required.
 - Highlight any numerical value within the patient record, right click and select Graph:
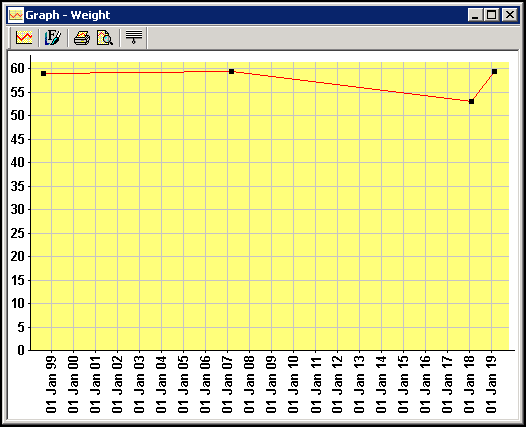
- From the graph you can:
- Expand the area you are interested, click hold and drag around the area you are interested in.
- Show Full Graph
 - Select to display the full graph.
 - Change Look of Graph
 - Select to display the Graph Styles - Weight screen and change the look of the graph:
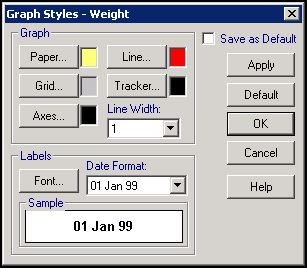
- Print
 - Select to print the graph.
 - Print Preview
 - Select to view the print before printing.
- Finally, select Close
 to exit.
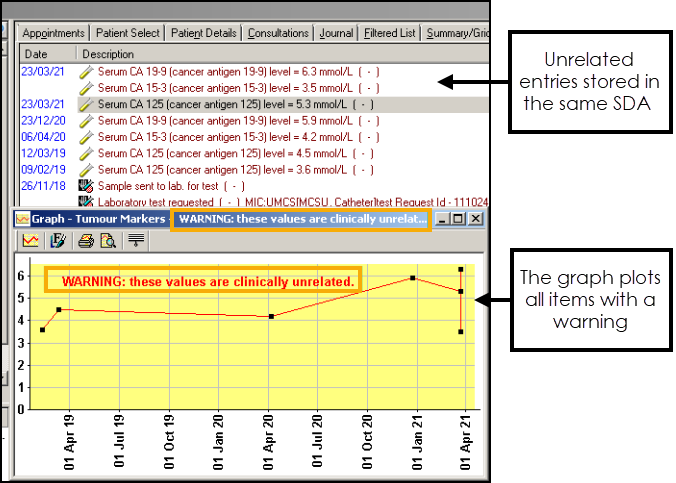
If you select to graph data that is stored in the same Structured Data Area (SDA) as data with different clinical terms, or data with the same clinical term but different units of measure, a warning displays. The warning displays on the graph, within the graph header and on the bottom toolbar and notifies you that the graph may not be a true representation of the data selected:
Note - To print this topic select Print  in the top right corner and follow the on-screen prompts.