The Contract Manager Screen
The Contract Manager screen is divided into different sections. The title bar displays the date Contract Manager was last updated, and you can access the different commands and functions using the toolbar.
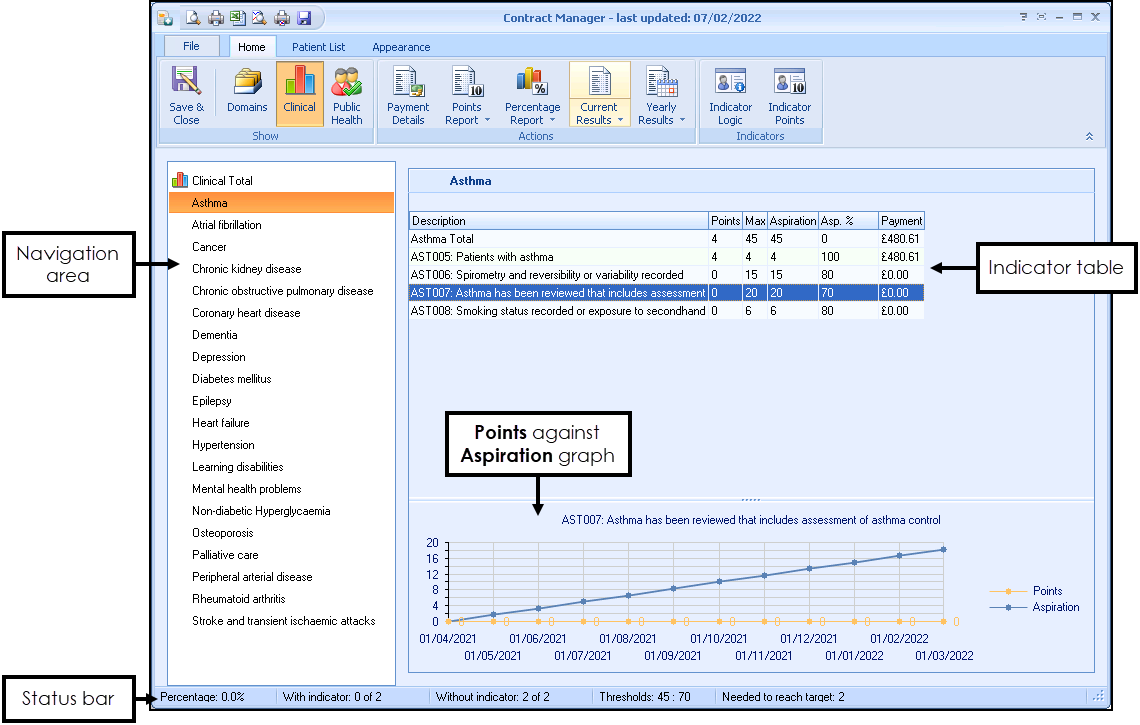
The Contract Manager screen consists of the following:
-
Navigation area - View information in the right-hand side pane. As you click on the different domains and categories, you'll see the information on the right-hand side of the screen change accordingly.
-
Indicator table - The upper right-hand side of the screen displays a grid showing detailed information about the indicator, current point totals, maximum possible points, your aspiration target if set, and the expected payment (which can be adjusted using the Specifying Payment and Prevalence Information screen).
-
Points against Aspiration graph - As you select the different indicators within the grid, the charts within the lower right section of the screen changes to a graph to enable comparison of the actual points the practice has obtained to that which it aspires to. You can also use the chart to view the historical trends for the points for the particular indicator you have selected in the grid. These are typically shown on a month-by-month basis for the current QOF/QAIF year.
-
Status bar - The status bar at the bottom of the screen is a very useful tool and shows some important information relating to point thresholds for the individual domains. The status bar displays the current Percentage, the number of patients With indicator, the number of patients Without indicator, the upper and lower Thresholds for the indicator (%) and the number Needed to reach target. Towards the end of the contract period the number needed to reach the target can play a vital role when allocating resources for the practice to attain the maximum points possible for each category.