Dashboard View
The Dashboard View displays a high level overview of appointments activity.
To access the Dashboard View:
- From the View menu, select Dashboard:

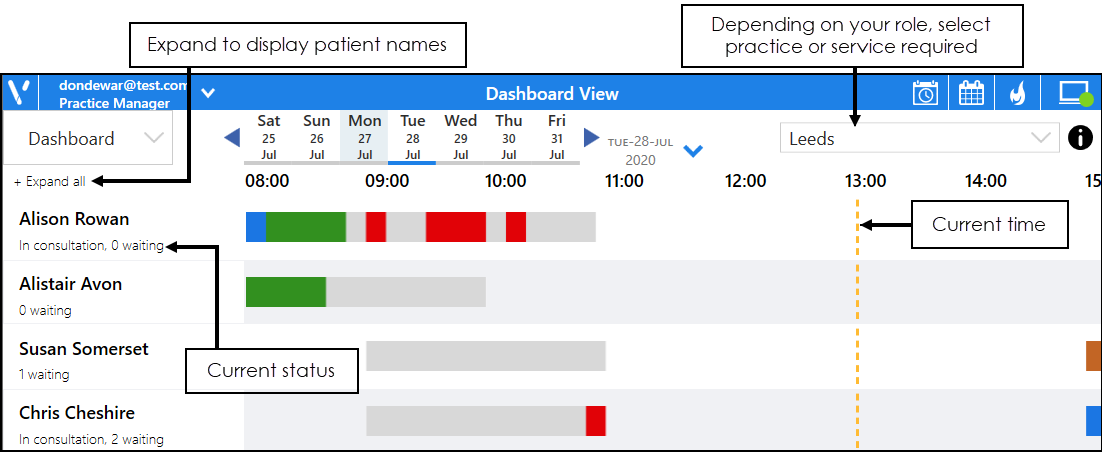
The Dashboard View displays:
- Session overviews, broken down by the status of the booked slots:
- Seen
- DNA
- Waiting
- In Consultation
- Arrived
- Available
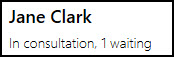
- Patients status count, by clinician.
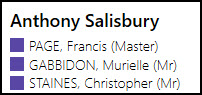
- Patient Details, if you select +Expand all at the top of the column:
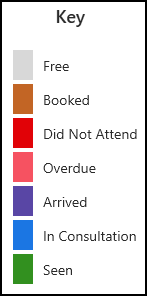
The colours on the screen follow the same format as the appointment status.
| Colour | Definition |
|---|---|
| Green | Seen |
| Blue | In consultation |
| Purple | Arrived |
| Pink | Overdue |
| Red | DNA |
| Grey | Free Slots |
| Empty white space | No clinic or session |
Select the View menu to return to the Reception View:
